SegmentStream provides users the capability to filter data in two primary ways: by date and by dimension values.
As of now, SegmentStream does not support filtering based on metric values.
Filtering by Date
To filter data in charts and tables by date:
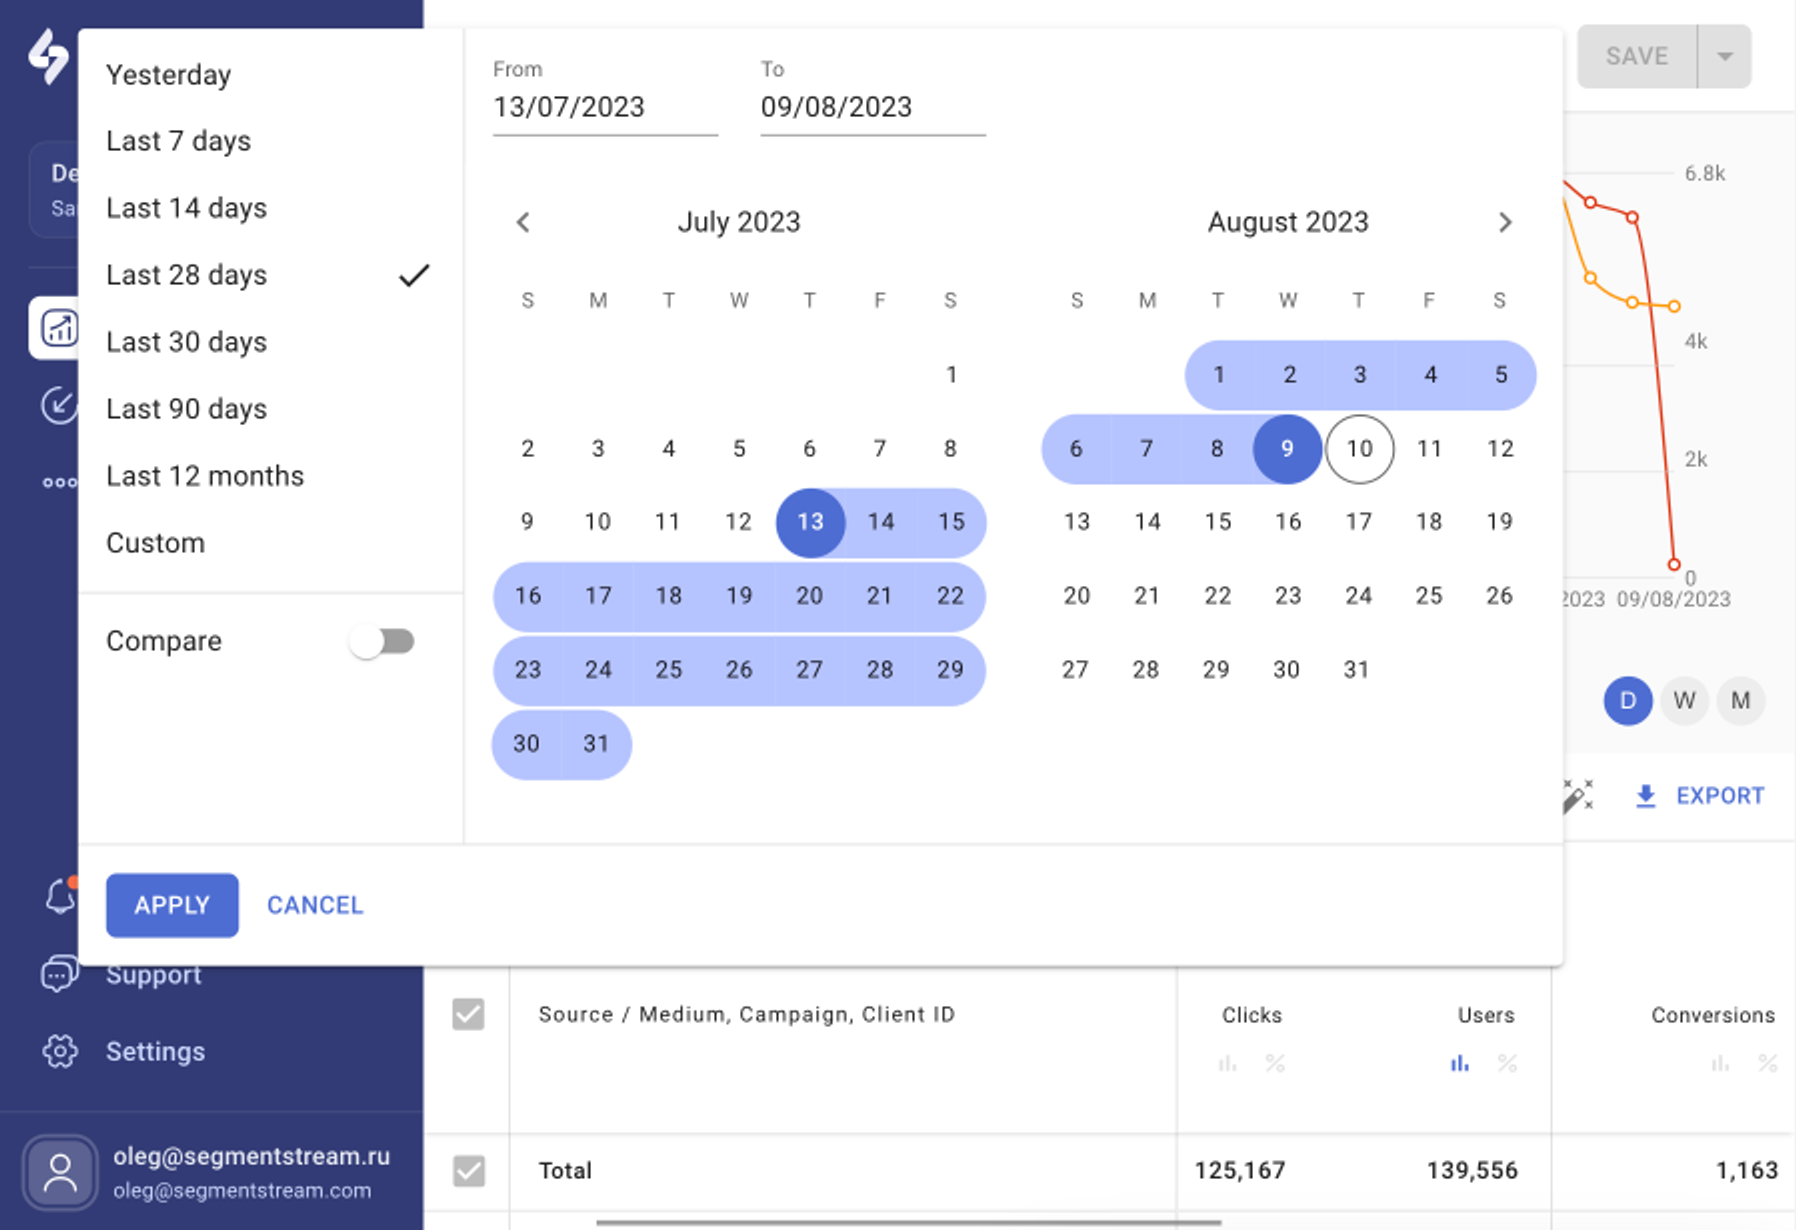
- Click on the calendar widget located at the top left corner.
- A dropdown will appear, allowing you to select from predefined date ranges:
- Yesterday
- Last 7 days
- Last 14 days
- Last 28 days
- Last 30 days
- Last 90 days
- Last 12 months
- Custom
The 'Custom' option empowers you to define any specific time period using the calendar control.
Comparing Time Periods
If you're interested in comparing metrics from different periods:
- Click on the 'compare' option in the date filter dropdown.
- This will activate several comparison options:
- Preceding Period: Automatically selects a period equal in length to the one you've defined.
- Preceding Period (match day of week): This ensures the preceding period not only matches in length but also starts on the same day. For instance, if you choose a period starting on a Monday, the preceding period will also start on a Monday.
- Same Period Last Year: A straightforward year-over-year comparison.
- Same Period Last Year (match day of week): Compares to the same period from the previous year, but also ensures both periods start on the same day of the week.
- Custom: Define your own preceding period using the input fields provided at the top of the date filter dropdown.
When comparison mode is enabled, each metric's table cell will display:
- The value for the current period at the top.
- The value from the compared period at the bottom.
- The calculated difference between the two values.
Charts do not support the comparison mode. Hence, charts will display data only for the selected current period.
Filtering by Dimension Values
SegmentStream provides the option to filter data in charts and tables based on dimension values. Here's how:
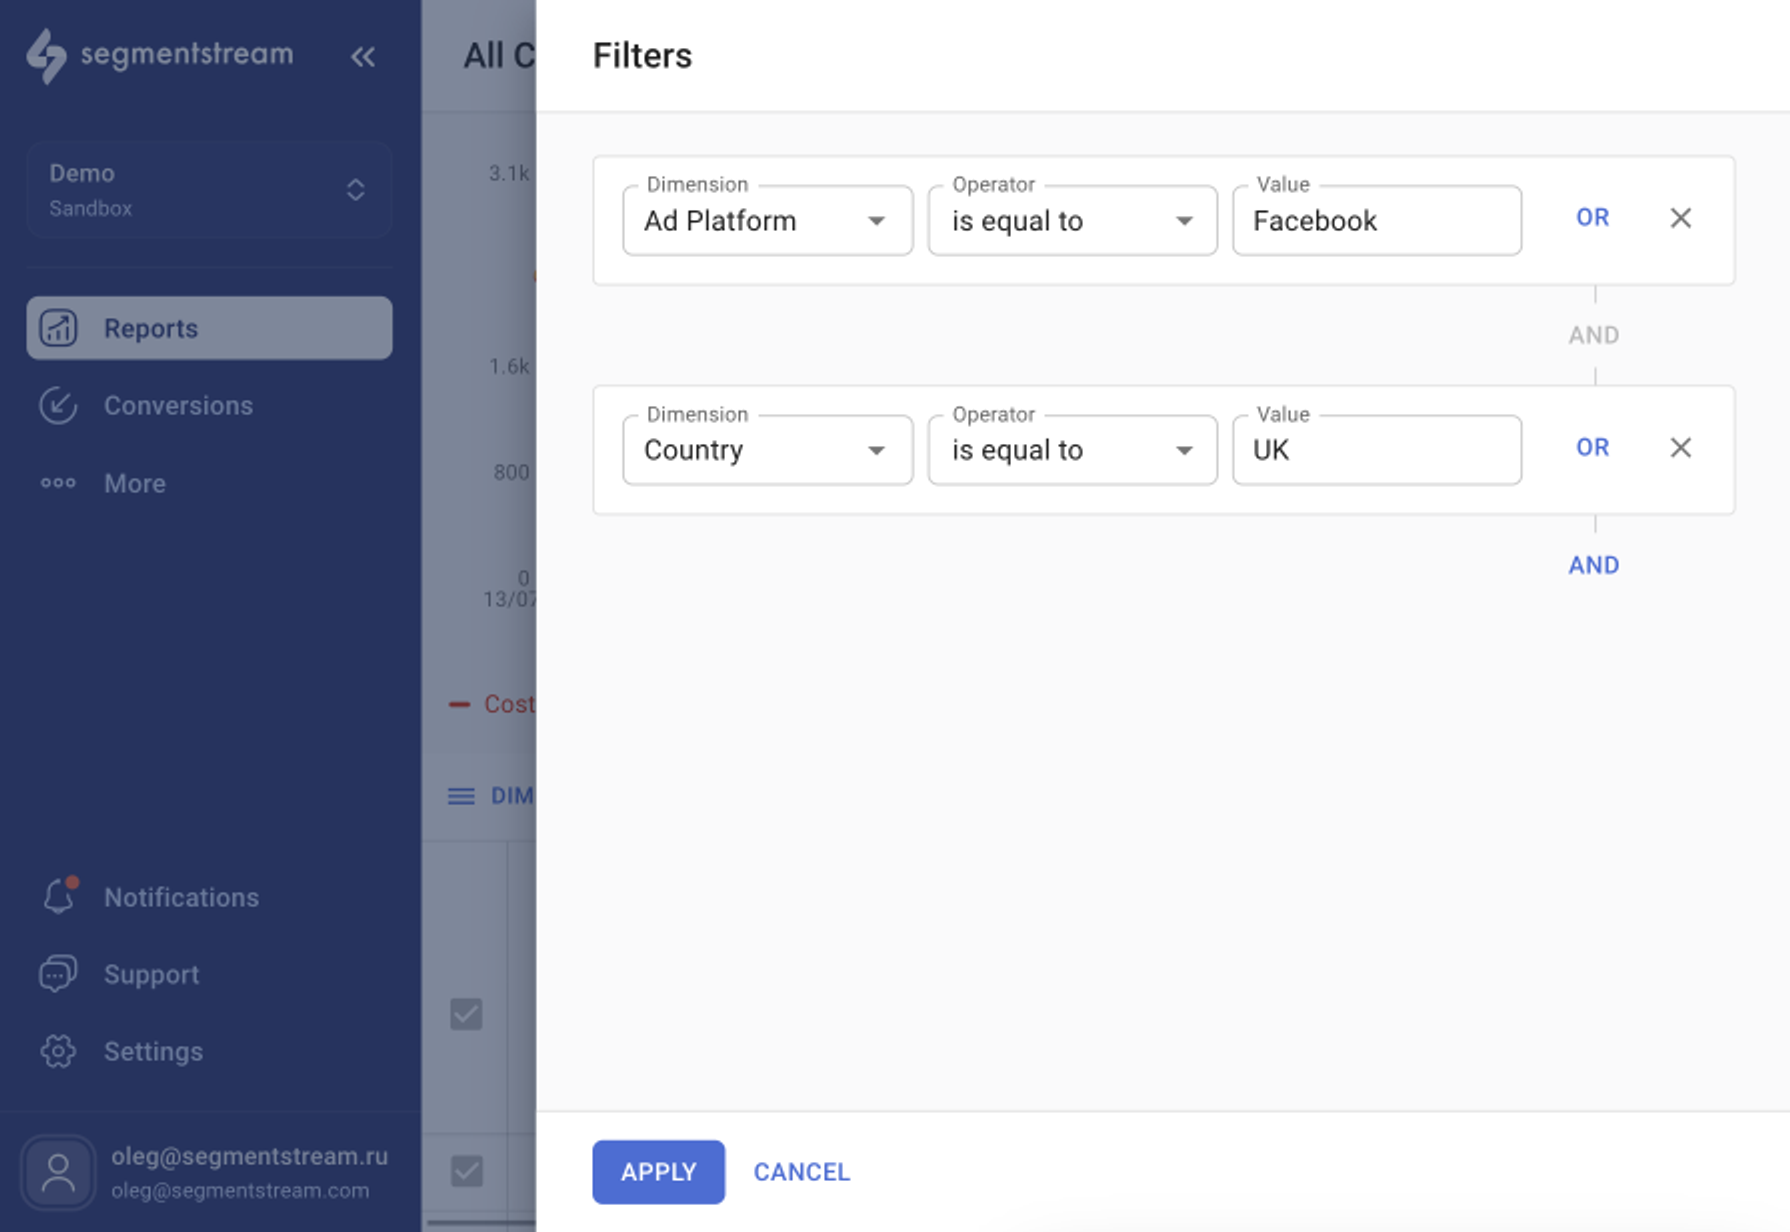
- Below the chart, click on the "Filters not set" button. This action will display a window for configuring advanced filters.
- Each filter row represents a rule. For instance, if you wish to view data exclusive to visitors from the UK:
- Select Dimension:
Country - Choose Operator:
is equal to - From the dropdown list, pick the value for the UK.
- Click Apply button.
You can establish multiple rules as needed, and connect them using either the AND or OR logic.
Examples:
- Display results where
Ad platform is equal to Facebook AdsANDCountry is equal to UK
- Showcase data where
Country is equal to UKORCountry is equal to US
- To view campaigns with "ES" in their name, use:
Campaign contains ES
Remember, you can combine and adjust these filters to cater to your specific data visualization needs.